Investment intelligence. With your reasoning in view.
Company research, portfolio context and a living investment case. Designed and developed by me, for a more considered way to invest.
Native iOS · In active development
The Exponent filmUnderstand more. Decide better.90 secondsEnglishRead the film summary
Look beyond the price. The film moves through company research, price and volume charts, a saved investment thesis, portfolio holdings and a proposed investment plan.
The central idea: understand the business, keep your reasoning in view and examine a plan before deciding. App demonstrations use illustrative data. Plans are proposals; you confirm decisions yourself.
A closer look at Exponent.Product film · 90 seconds · Sound on for the full experienceExplore the project
The thinking behind the product
From a question to a considered decision.
Six perspectives. One connected investment workspace.
01 / Problem
More information. Less clarity.
A price chart tells you what moved. A report tells you what happened. Neither remembers why you invested. The reasoning gets lost between tools.
Scattered researchDisconnected decisions
01 / 06
The missing connectionEvidence → reasoning → decision
Company researchEnglish interface · Demonstration data
Joined Studioworks’ 24/7 service floor in Tallinn. The starting point was direct service delivery: understanding the standards, the pace and what a dependable handover requires.
Service delivery
Quality standards
Working in a 24/7 cycle
a live service environment24/7Studioworks OÜ · Tallinn
Before planning an operation, understand the people and the work the plan has to support.
Senior operational role
Connect the work across a shift.
Took on quality evaluation, incident handling, escalation and shift coordination. Responsibility expanded from individual delivery to understanding how people, standards and service depend on each other.
An incident is more than a single interruption. Its cause, escalation and handover all affect the next decision.
Shift Operational Manager · 2025–present
People, capacity and performance.
Lead shift-level operations across two portfolios. Connect workforce planning, service availability and people development with the systems that make the work measurable.
Portfolios
2
Service lines
Up to 19
Operation
24/7
Explore the responsibilityDiagnose · 2 / 4
61employees concurrently scheduledPeak coverage · up to 19 service lines
Make the staffing plan deliverable.
Challenge
Nominal headcount does not equal available coverage.
My contribution
Translate demand into service hours and FTE, then reconcile skills, rotations and planned closures with Scheduling.
Outcome
Up to 10,900 service hours planned in a month; 49,800 across the January–May 2026 cycles.
Took on escalation and incident handling, shift coordination and quality evaluation, expanding from individual service delivery to a wider operational role.
Operations, workforce planning & analytics: capacity plan ownership, the availability KPI (99.84% across 49,900 agreed service hours), the monthly reporting model, hiring decisions.
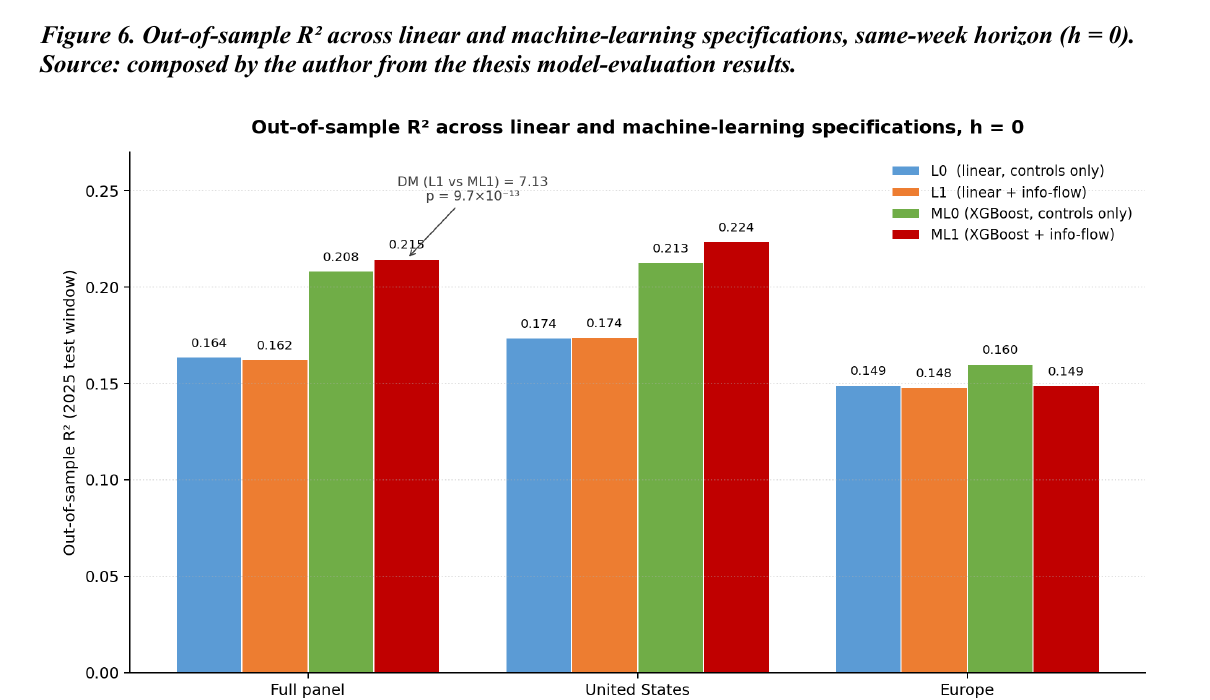
25,876 firm-week observations across 99 U.S. and European firms. XGBoost 0.2146 same-week out-of-sample R² against a 0.1624 linear benchmark; the European gain is not significant and the one-week-ahead null is stated.
Panel
25,876 firm-week observations
Coverage
99 firms · US & Europe
Final test period
2025 · held out
Same-week explanation and next-week prediction are evaluated separately.Explore the research↗
Systems
NEXUS Terminal — research build
A native decision workspace: 96 registered views, 67 native commands, six evidence layers. Research and paper state only — documented in the thesis, no live trading claimed.
Four instruments computing in the page — simulation, frontier, stress and derivatives — with no external numerical dependencies and the closed-form answer kept on screen as the check.
Five applications of the same discipline: turn source data into research, reporting or decisions people can inspect. Explore the result, how it works, and the limits of each system.
Bachelor's thesis — Can online attention improve weekly return models?
Better same-week fit in the full panel; no robust next-week predictability
Boundary: At a one-week-ahead horizon, no model produced robust out-of-sample predictability. Reported explicitly; not presented as a trading rule.
NEXUS Terminal — Evidence, models and risk in one research workspace.
Brings source evidence, model results and risk checks into one research workspace
Boundary: Research and paper state only. No live trading performance is claimed and no production execution-control readiness is claimed.
Evaluation tool — From evaluation screenshots to reviewed monthly reporting.
Turns evaluation screenshots into reviewed, traceable monthly reporting
Boundary: The interface shown on this site is an anonymised reconstruction. It does not claim perfect extraction or automatic accuracy.
Quant Lab — Explore portfolio assumptions directly in your browser.
Lets visitors test portfolio assumptions and compare numerical results with analytical checks
Boundary: Educational instruments on user inputs. No market data, no calibration to real assets, and nothing on the screen is investment advice.
Replaces the manual relay with direct access to evaluations and a weekly leadership digest
Boundary: The platform surfaces coverage gaps; closing them remains a management routine. Scoring consistency is governed by the written framework and manager cross-checks — not by the tool itself.
Bachelor's thesis
01 / 05
Research Published study, reproducible
Can online attention improve weekly return models?
What it delivers
Better same-week fit in the full panel; no robust next-week predictability
Yahoo Finance, Finnhub, Google Trends, NewsAPI and FinBERT / Loughran–McDonald scoring. ≈130,000 outbound calls.
Acquire
Compare the workChoose two projects. See their purpose, evidence and limits together.+
Comparison of Bachelor's thesis and NEXUS Terminal
Project
Bachelor's thesis
NEXUS Terminal
State
ResearchPublished study, reproducible
Paper stateInstalled build, no live execution
What it delivers
Better same-week fit in the full panel; no robust next-week predictability
Brings source evidence, model results and risk checks into one research workspace
Scale & evidence
0.2146same-week OOS R²
96registered views
Stack
PythonSQLBigQuery
TypeScriptRustTauriReact
Scope & limits
At a one-week-ahead horizon, no model produced robust out-of-sample predictability. Reported explicitly; not presented as a trading rule.
Research and paper state only. No live trading performance is claimed and no production execution-control readiness is claimed.
Research · EBS bachelor’s thesis, 2026
Online Information Flowand Short-Term Stock Returns.
Linear and machine-learning evidence from the U.S. and European markets. Estonian Business School bachelor’s thesis, 2026 — an auditable pipeline that turns raw price, attention and news data into interpretable models, then validates them under a strict chronological design.
Test whether abnormal search activity, news intensity and financial-news sentiment add incremental information to short-horizon equity-return models after controlling for market, volatility, liquidity, size, value, momentum and sector effects.
990123456789012345678901234567890123456789large-cap firms50 U.S. · 49 European
The 2025 block is touched once, after the model is frozen. Nothing to its left is re-fitted afterwards—which is what makes the out-of-sample figure below an out-of-sample figure.
Diebold–Mariano 7.13, p < 0.001 — the gain survives the test.
This measures same-week explanatory power. It is not a next-week return forecast.
Compare all reported values +
Out-of-sample R², same-week horizon
Market
Pooled OLS
XGBoost
Interpretation
Full panel
0.1624
0.2146
Diebold–Mariano 7.13, p < 0.001 — the gain survives the test
United States
0.1740
0.2237
Strongest regional result across the study
Europe
0.1479
0.1489
Incremental machine-learning gain not statistically significant
ASVI was the highest-ranked information-flow feature in SHAP attribution.
Thesis · Figure ML-A · SHAP attribution
Four weeks. One feature. A change of sign.
Pushes the prediction upPushes it downSHAP contribution to NVDA weekly return · bps
+28
W0820 Feb 2025Rally, rising attention
+5
W2230 May 2025Sell-off, weak ASVI
-18
W3101 Aug 2025Panic-search regime
+35
W4507 Nov 2025Rally, rising attention
A pooled linear model has one ASVI coefficient and must pick a single sign. Attention behaved differently in a rally than in a panic-search week—and reproducing that is where the machine-learning gain in the table above actually comes from.
The boundary this research reports
At a one-week-ahead horizon, no model produced robust out-of-sample predictability.
Forecasting models did not outperform the mean-return benchmark. The thesis states this explicitly and does not present the result as a standalone trading rule. Same-week explanatory power and next-week forecasting power are different claims, and only one of them survived the test.
End-to-end capability
01Acquire≈130,000outbound callsAcross five external sources.
02Engineer13variablesASVI, news intensity, FinBERT and Loughran–McDonald sentiment.
03Model4specificationsPooled OLS benchmark against XGBoost, Random Forest and Elastic Net.
04Validate≈2,916grid fitsOne evaluation on the frozen 2025 window.
05AttributeSHAPper observationTree SHAP decomposition with stage-level audit logs.
Model-risk discipline
⊘
No look-ahead
Every predictor is available by the close of week t. Nothing in the feature set could only be known later.
❄︎
Frozen pre-processing
Scaling and encoding are fitted on training data only, then frozen for validation and test.
1
One shot at the test window
A 243-setting hyperparameter grid is selected on 2024 validation alone; the 2025 window is touched once.
−
Negative results retained
Insignificant and regime-sensitive outcomes stay in the thesis instead of being trimmed out of the story.
19-module Python pipeline, plus TypeScript, Rust and SQL infrastructure
Fixed seeds, cached inputs, version-pinned release and stage-level audit logs
Full reproducibility set reruns from a clean clone in ≈70 minutes
Five years at Studioworks, progressing from service delivery to shift-level planning, reporting and operational analysis. This record connects my responsibilities with measured outcomes.
~97~0123456789012345678901234567890123456789FTE workforce base plannedHR-sourced
190123456789012345678901234567890123456789service lines · two portfoliosplanning scope
99.840123456789012345678901234567890123456789.0123456789012345678901234567890123456789%Combined availabilityContractual KPI met
Agreed service hours
49,90049,900
Delivered
49,81949,819
Unplanned downtime
8181 h
Jan–May 2026 planning cycles. Downtime is attributed by driver rather than absorbed into a single figure.
Demand becomes service hours, service hours become people.
61concurrently scheduledagainst a ~97 FTE planned base
19 service lines · two portfolios
Split shown by portfolio grouping, not by line volume.
9,960cycle average10,900monthly peak
49,800 service hours planned across the Jan–May 2026 cycles.
Lead a 24/7 operation with up to 61 employees concurrently scheduled across two portfolios and up to 19 service lines, balancing demand against staffing supply, skill certification and rotation constraints.
Translate demand into service-hour and FTE requirements — up to 10,900 service hours per month, 49,800 across the Jan–May 2026 cycles — reconciled line by line against agreed service time and planned closures.
Convert the HR-sourced FTE base into coverage and quality ratios per service line, quantifying effective staffed hours against nominal headcount to expose gaps before they reach service.
Own the handover to Scheduling: raise coverage and feasibility constraints and keep every plan change traceable to an approved assumption.
Coverage & supply — Demand becomes service hours, service hours become people.
Lead a 24/7 operation with up to 61 employees concurrently scheduled across two portfolios and up to 19 service lines, balancing demand against staffing supply, skill certification and rotation constraints.
Translate demand into service-hour and FTE requirements — up to 10,900 service hours per month, 49,800 across the Jan–May 2026 cycles — reconciled line by line against agreed service time and planned closures.
Convert the HR-sourced FTE base into coverage and quality ratios per service line, quantifying effective staffed hours against nominal headcount to expose gaps before they reach service.
Own the handover to Scheduling: raise coverage and feasibility constraints and keep every plan change traceable to an approved assumption.
Availability & downtime — The contractual KPI, and the 81 hours it absorbed.
Deliver 99.84% combined availability across 49,900 agreed service hours, meeting the contractual availability KPI and holding unplanned downtime to 81 hours.
Own the escalation and downtime register: 170 incidents across 11 monthly cycles, 168 with timed start-to-fix durations, each classified by cause.
Rebuilt the incident resolution-time KPI as formula-driven output from source records, clearing 48 pre-existing formula errors.
Separated downtime frequency from downtime impact: the most frequent fault category and the costliest were not the same — and redirected mitigation to the smaller, costlier driver.
Productivity assumptions — Assumption drift is a capacity risk before it is a variance.
Test the productivity and AHT assumptions behind the plan against realised data every cycle — required service hours and FTE scale inversely with realised throughput.
Identified a systematic drift across five consecutive cycles in a core planning input, raised it as an assumption problem rather than a one-off variance, and used quality and downtime data to separate causes.
Data & KPI governance — Every published figure traceable back to a source row.
Own 10-sheet monthly reporting across two portfolios and 10+ KPIs, consolidating five sources in a 3,400+ formula-cell model with eight defined KPI steps.
Validate 140,000+ records over five cycles, excluding duplicates and voided entries and resolving cross-sheet inconsistencies before publication.
Govern a 55-code error taxonomy covering 450+ coded exception records and 190 voided transactions split by manual and system cause.
Evaluation & hiring — Scoring that stays comparable between managers.
Run structured performance evaluation against an anchored 0–5 scale with a defined observation minimum and 10 assessments per employee per month, reconciling scoring across evaluators.
Interview candidates and contribute directly to final hiring decisions, assessing skill and operational judgement against current and forecast coverage needs.
Assess the staffing impact of demand and supply changes — line openings and closures, absence spikes, training lead times, attrition.
Report assumptions, risks and trade-offs to Scheduling, HR, IT and operational leadership.
Plan vs actual · KPIs owned and reported
What the data showed, and what changed because of it.
Service availability
99.84%across 49,900 agreed hours
Contractual KPI met
→
Downtime attributed by driver, not absorbed into one figure
Throughput & AHT assumptions
5consecutive cycles
Systematic drift — not one-off variance
→
Re-based the service-hour requirement; flagged capacity risk
Effective staffed hours
Gapnominal vs deliverable
Headcount overstated available hours
→
Coverage adjusted per service line before it reached service
Incident resolution time
168of 170 timed at source
The data existed; the KPI did not use it
→
KPI rebuilt formula-driven; auditable to source
Built in-house · in production use
Three systems the operation now runs on.
01
Monthly Operational Performance & Availability Model
Advanced Excel · two portfolios · up to 19 service lines
10sheets~2,900calc rows8KPI steps2portfolios
Eight numbered steps from total possible hours through availability, FTE and coverage per line, to error rates and mean resolution time.
Reconciled monthly against five source feeds and reported plan-vs-actual with variance commentary.
02
Company-wide Employee Performance Platform
Python · SQL · web application · 136 employees
5data domains4user groups136employeesRBACaccess
Self-initiated. Evaluations, errors, attendance, attitude and skills in one place, with role-based access and database-backed logging.
Replaced scattered manual records with a single auditable source for absence, error and skill data.
The framework the operation is scored against, plus an offline scenario trainer and a monthly schedule-review matrix.
Standardised how quality and coverage data enter the reporting cycle.
Additional experience
Southwestern Advantage — Texas, USA
Sales Representative · Summer 2024
Ran an independent sales territory through a 12-week field programme, planning daily activity from conversion data and adapting targets weekly in a fully autonomous international environment.
Skills & tools
A practical toolkit.Grounded in real work.
Financial risk, quantitative methods, engineering and operations. Explore the skills I use and the projects where each has been applied.
Filter by a body of work, then follow the evidence links to see where each skill has been applied.
24 capabilities · 5 bodies of work
Skill / supporting work
01
Financial risk
6
Value at Risk & Expected ShortfallHistorical and parametric, $100k position
⛭Team leadershipShift organisation across a 24/7 rotation, up to 61 people concurrently scheduled.✚RecruitmentCandidate interviews and direct contribution to final hiring decisions.◫Performance managementAnchored evaluation, coaching, feedback and structured improvement plans.⇄Stakeholder communicationAssumptions, risks and trade-offs reported to Scheduling, HR, IT and leadership.▲Risk escalationConstraints escalated with quantified impact when they cannot be absorbed at shift level.
Primary evidence
Open the underlying work.
Research figures, product screens and system architecture. Open any item to inspect the original at full resolution.
Additional risk foundation · Disney, $100k position
Value at Risk is a quantile, not a number.
248 daily returns · Apr 2024 — Apr 2025
95%$2,56899%$6,409
−8%−4%0+4%+8%
Reads the loss straight off the observed distribution — the 5th and 1st percentile of what actually happened.
The two methods disagree, and the disagreement is the finding.At 99% the historical figure is $6,409 against a parametric $4,424. The observed left tail is fatter than the normal assumption allows, so the parametric model understates the loss by roughly $2,000 exactly where it matters most.
Academic exercise on 248 daily returns from $100,000 notional; not a current investment view.
Recognition
Winner — Baltic Essay Contest in GermanAwarded for written argument in German, alongside a 12-week autonomous sales programme run entirely in English in Texas.
Risk console
A working miniature of the terminal.
The panels carry the same verified figures published across this site; the VaR and valuation calculators run right here in the page on the formulas shown. No market feed, and nothing represents a live position.
NEXUSportfolio editionpaper statesrc 5 feeds · 25,876 obsno live data
Daily · scales the published Disney study to your position · not advice
Valuation · two-stage DCFlive calculator
$92intrinsic value / share
years 1–5 · $23terminal · $69
r \ g∞2.00%2.50%3.00%8.0%$101$109$1179.0%$86$92$9810.0%$75$79$84
Two-stage DCF · 5y explicit + Gordon terminal · your inputs only — not advice
SHAP attributionFigure ML-A
+28W08
+5W22
-18W31
+35W45
ASVI flips sign across four 2025 regimes
NEXUS · portfolio edition — published figures, plus calculators that run right here.
Type `help`, or select a module on the left.
$↑Tab↵
Quant Lab
Explore risk.Test an assumption.
Explore simulation, portfolio allocation, stress and options. Change the inputs and compare the results with analytical checks. Educational models, with assumptions visible and no live market feed.
Instrument I · simulation
Monte Carlo wealth paths
Geometric Brownian motion, monthly steps, seeded — the same inputs always reproduce the same run.
median pathP25–P75P5–P95
terminal (10y)
simulated
closed form (GBM)
median wealth
—
$162,824
5th percentile
—
$74,623
95th percentile
—
$355,275
P(end below start)
—
15.2%
median max drawdown
—
path property — no closed form
The simulated and closed-form columns must agree — that agreement is the check that the engine is right, and the test suite enforces it. Your inputs · standard model · no market data · not advice.
Instrument II · optimisation
Efficient frontier, three assets
4,000 long-only random portfolios against the closed-form Markowitz frontier. The frontier itself is unconstrained, so it may short.
Asset A · growth
Asset B · income
Asset C · diversifier
correlations · rf
σ → 21%μ -1% → 9%
random long-onlyfrontiertangency
frontier @ μ*
weight
Asset A · growth
30.7%
Asset B · income
24.6%
Asset C · diversifier
44.7%
portfolio σ
8.7%
tangencyμ 5.8% · σ 8.4% · Sharpe 0.46
Closed-form Markowitz on your parameters. Negative weights are short positions — the unconstrained frontier allows them and they are shown, not hidden. No market data · not advice.
Instrument III · risk
Stress bench
The same three assets under a named shock. The waterfall shows which assumption change does the damage — usually correlations.
$4,192baseline
$8,269σ shock
$9,381+ correlations
$9,411+ drift
daily · 99%
baseline
Risk-off
Value at Risk
$4,192
$9,411 · ×2.2
Expected shortfall
$4,812
$10,787
portfolio μ · σ (annual)
6.5% · 11.6%
Parametric under normality — a deliberate simplification, and the reason the thesis reports historical VaR beside it. Your inputs · no market data · not advice.
Instrument IV · derivatives
Option pricing and the hedging experiment
Black–Scholes in closed form on the left; on the right, what a desk actually lives with — the P&L of a delta-hedged short call under discrete rebalancing.
value todaypayoff at expiryyour spot
quote
call
put
price
9.41
6.46
delta Δ
0.599
-0.401
gamma Γ
0.0193
vega / vol pt
0.387
theta / day
-0.015
short 1 call · 1y · hedged with Δ shares · 4,000 paths
—mean P&L
—σ of P&L
—5th percentile
—σ / premium
A perfectly hedged book would sit at zero. What remains is discretisation risk — tighten the rebalance and σ shrinks roughly with √frequency; the test suite asserts the ordering. Hedged at the pricing vol · no market data · not advice.
Tallinn, Estonia · Open to what’s next
Good work starts with a conversation.
Financial research. Analytical systems. Operations. Let’s find the question worth working on.
What do you have in mind?
A role where research, systems thinking and operational experience can make a difference.
Investment intelligence. With your reasoning in view.
Company research, portfolio context and a living investment case. Designed and developed by me, for a more considered way to invest.
Native iOS · In active development
The Exponent filmUnderstand more. Decide better.90 secondsEnglishRead the film summary
Look beyond the price. The film moves through company research, price and volume charts, a saved investment thesis, portfolio holdings and a proposed investment plan.
The central idea: understand the business, keep your reasoning in view and examine a plan before deciding. App demonstrations use illustrative data. Plans are proposals; you confirm decisions yourself.
A closer look at Exponent.Product film · 90 seconds · Sound on for the full experienceDiscuss the product
The thinking behind the product
From a question to a considered decision.
Six perspectives. One connected investment workspace.
01 / Problem
More information. Less clarity.
A price chart tells you what moved. A report tells you what happened. Neither remembers why you invested. The reasoning gets lost between tools.
Scattered researchDisconnected decisions
01 / 06
The missing connectionEvidence → reasoning → decision
Company researchEnglish interface · Demonstration data
Six connected capabilities. Explore how the pieces work together.
A reason to investigate. With the evidence attached.
Explore companies through cash-flow quality, valuation and the direct sector weights of your portfolio. Each candidate carries the metric, report date, source and questions still worth asking.
Move a candidate into your own investment case.
See data gaps and the reasons a company was excluded.
Research candidatesMetric · report · source · risk
A defined research scope, not an all-market ranking or a buy signal.
Designing for trust
Clear boundaries. Better decisions.
The app supports research, comparison and an explicit decision process. Confirming a plan is separate from executing a trade; portfolio reconciliation remains deliberate.
Exponent is an independent application in active development. These are actual app screens with demonstration data. This showcase is not a public download or a brokerage service.